
In early June 2025, thousands of applications hosted on Heroku suddenly went offline. Even Heroku’s own dashboard became unreachable, leaving engineers in the dark. Businesses relying on Heroku scrambled as critical website features—logging infrastructure, customer-facing apps, e-commerce backends—failed across the web. What unfolded was arguably the biggest outage in Heroku’s history, with nearly 24 hours of disruption for many customers.
When Heroku later published its incident report, a surprisingly mundane root cause emerged: a single unplanned software update had disrupted network connectivity across Heroku’s entire infrastructure.
As Heroku worked to diagnose and resolve the issue, they ran into another obstacle: their internal monitoring and status systems were running on the same infrastructure that had just broken. As network connectivity collapsed, Heroku’s operations team was left blind—not only facing a massive outage but also losing critical tools required for diagnosis and communication with customers. The Heroku Status Page, support ticketing, and other internal dashboards became inaccessible right when they were needed most.
This combination of control failure (unintended update execution), resilience failure (broken script), and architectural oversight (internal tools coupled with production networks) significantly delayed troubleshooting. It took roughly 8 painstaking hours just to identify the root cause, and nearly an entire day to fully restore services.
Heroku’s outage provides valuable insights into best practices for managing upgrades effectively:
A final, critical insight from the Heroku outage is that it was not an isolated incident—in fact, it was almost a repeat of a prior high-profile outage. In March 2023, Datadog suffered a two-day, multi-region outage when the exact same Ubuntu 22.04 unattended update restarted systemd and wiped IP routes across tens of thousands of VMs.
Datadog’s team publicly documented the incident and outlined clear remediations to prevent such a scenario from recurring:
Yet two years later, Heroku repeated the same misstep. The reality is that it’s easy to miss learnings from other teams’ post-mortems.
Industry incident reports are valuable resources—but only if you see them in time and translate them into actionable tasks for your environment. In fast-moving teams, engineers are heads-down on features, and lessons from other companies get buried in Slack threads, newsletters, or PDFs.

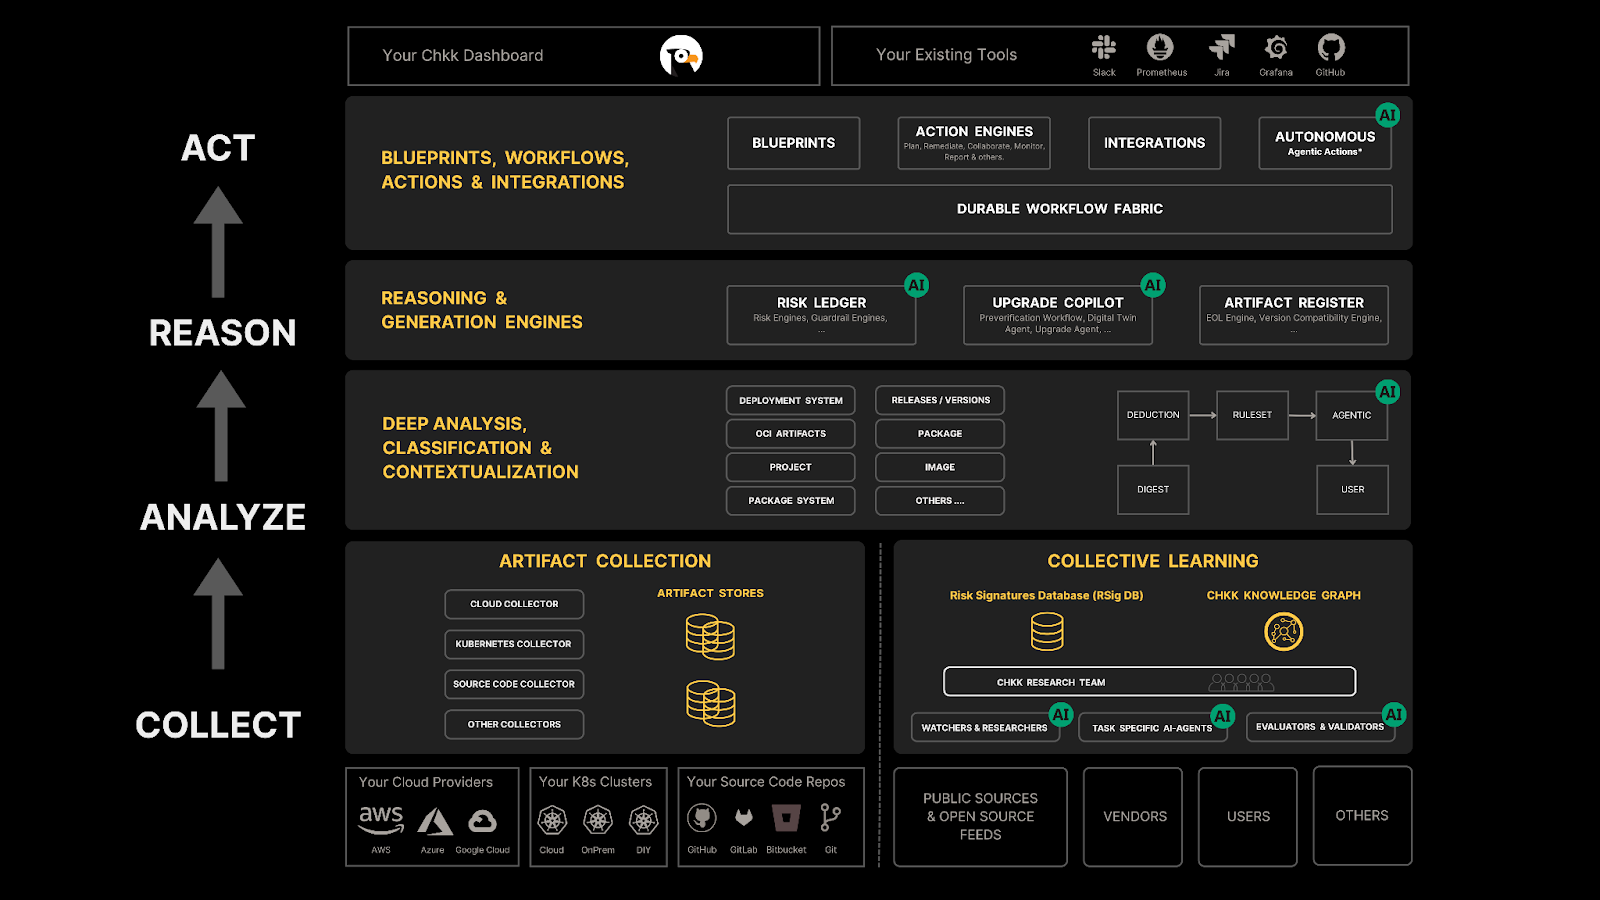
Chkk always-on knowledge engine aggregates post-mortems, CVEs, GitHub issues, and changelogs from 100s of OSS projects (e.g., Elasticsearch, Kafka, Istio, RabbitMQ, Keycloak, ArgoCD, and more) and major cloud providers. It then:
This ensures that the moment a community, cloud or vendor discloses a breaking change, publishes a versioned artifact or posts changelogs, they are ingested, verified, tagged, curated and made available for downstream reasoning within minutes. Put simply, Chkk Collective Learning turns industry hindsight into your operational foresight.